Sign In
Welcome Back,
Signup/Login with your account
Signup/Login with your account
Please briefly explain why you feel this question should be reported.
Please briefly explain why you feel this answer should be reported.
Please briefly explain why you feel this user should be reported.

 Signup/Login with Google
can i add description for kpis?
Yes, you can add description for KPI's. When you are creating any particular chart, metric or KPI you can add its description, which can be accessed through the "i" button in published dashboard. Please read below guide to understand how it works: https://help.lumenore.com/knowledge-base/dashboard/iRead more
Yes, you can add description for KPI’s. When you are creating any particular chart, metric or KPI you can add its description, which can be accessed through the “i” button in published dashboard.
Please read below guide to understand how it works:
https://help.lumenore.com/knowledge-base/dashboard/interacting-with-chart/ai-insights/#information-icon
See lessHow will I get help to understand what are the faetures or sections available in Lumenore and how to create visuslization step by step ?
You can start by watching the onboarding video available within the product, which can be easily accessed from the Get Started section in the top-right corner of the interface. Additionally, you can explore the Lumenore Help section, which includes a comprehensive knowledge base and the Lumenore LeaRead more
You can start by watching the onboarding video available within the product, which can be easily accessed from the Get Started section in the top-right corner of the interface.
Additionally, you can explore the Lumenore Help section, which includes a comprehensive knowledge base and the Lumenore Learning Platform for detailed guidance. You can also visit Lumenore’s YouTube channel for more explainer videos and step-by-step tutorials.
See lessDo you have a feature where we can adjust assumptions (for example price or volume) and see the impact on KPIs or dashboards?
Yes, if you want to perform scenario analysis and understand the impact on KPIs by adjusting specific measures, you can easily do so using the What-If Parameter feature. Below is the user guide to help you create a What-If Parameter. https://help.lumenore.com/knowledge-base/schema-manager/variable/wRead more
Yes, if you want to perform scenario analysis and understand the impact on KPIs by adjusting specific measures, you can easily do so using the What-If Parameter feature.
Below is the user guide to help you create a What-If Parameter.
https://help.lumenore.com/knowledge-base/schema-manager/variable/what-if-parameter/
See lesshow to create custom chart
You can leverage Lumenore’s extensive library of pre-built charts. If you need additional or more specialized visualizations, you can use Lumenore’s custom chart creation functionality. Below is the user guide to help you create a custom chart. https://help.lumenore.com/knowledge-base/dashboard/creaRead more
You can leverage Lumenore’s extensive library of pre-built charts. If you need additional or more specialized visualizations, you can use Lumenore’s custom chart creation functionality. Below is the user guide to help you create a custom chart.
https://help.lumenore.com/knowledge-base/dashboard/create-custom-charts-using-code-editor/
See lessWhen I create a dashboard, is there any tour or guidance available on how to use it, organize the data, and create different dashboards?
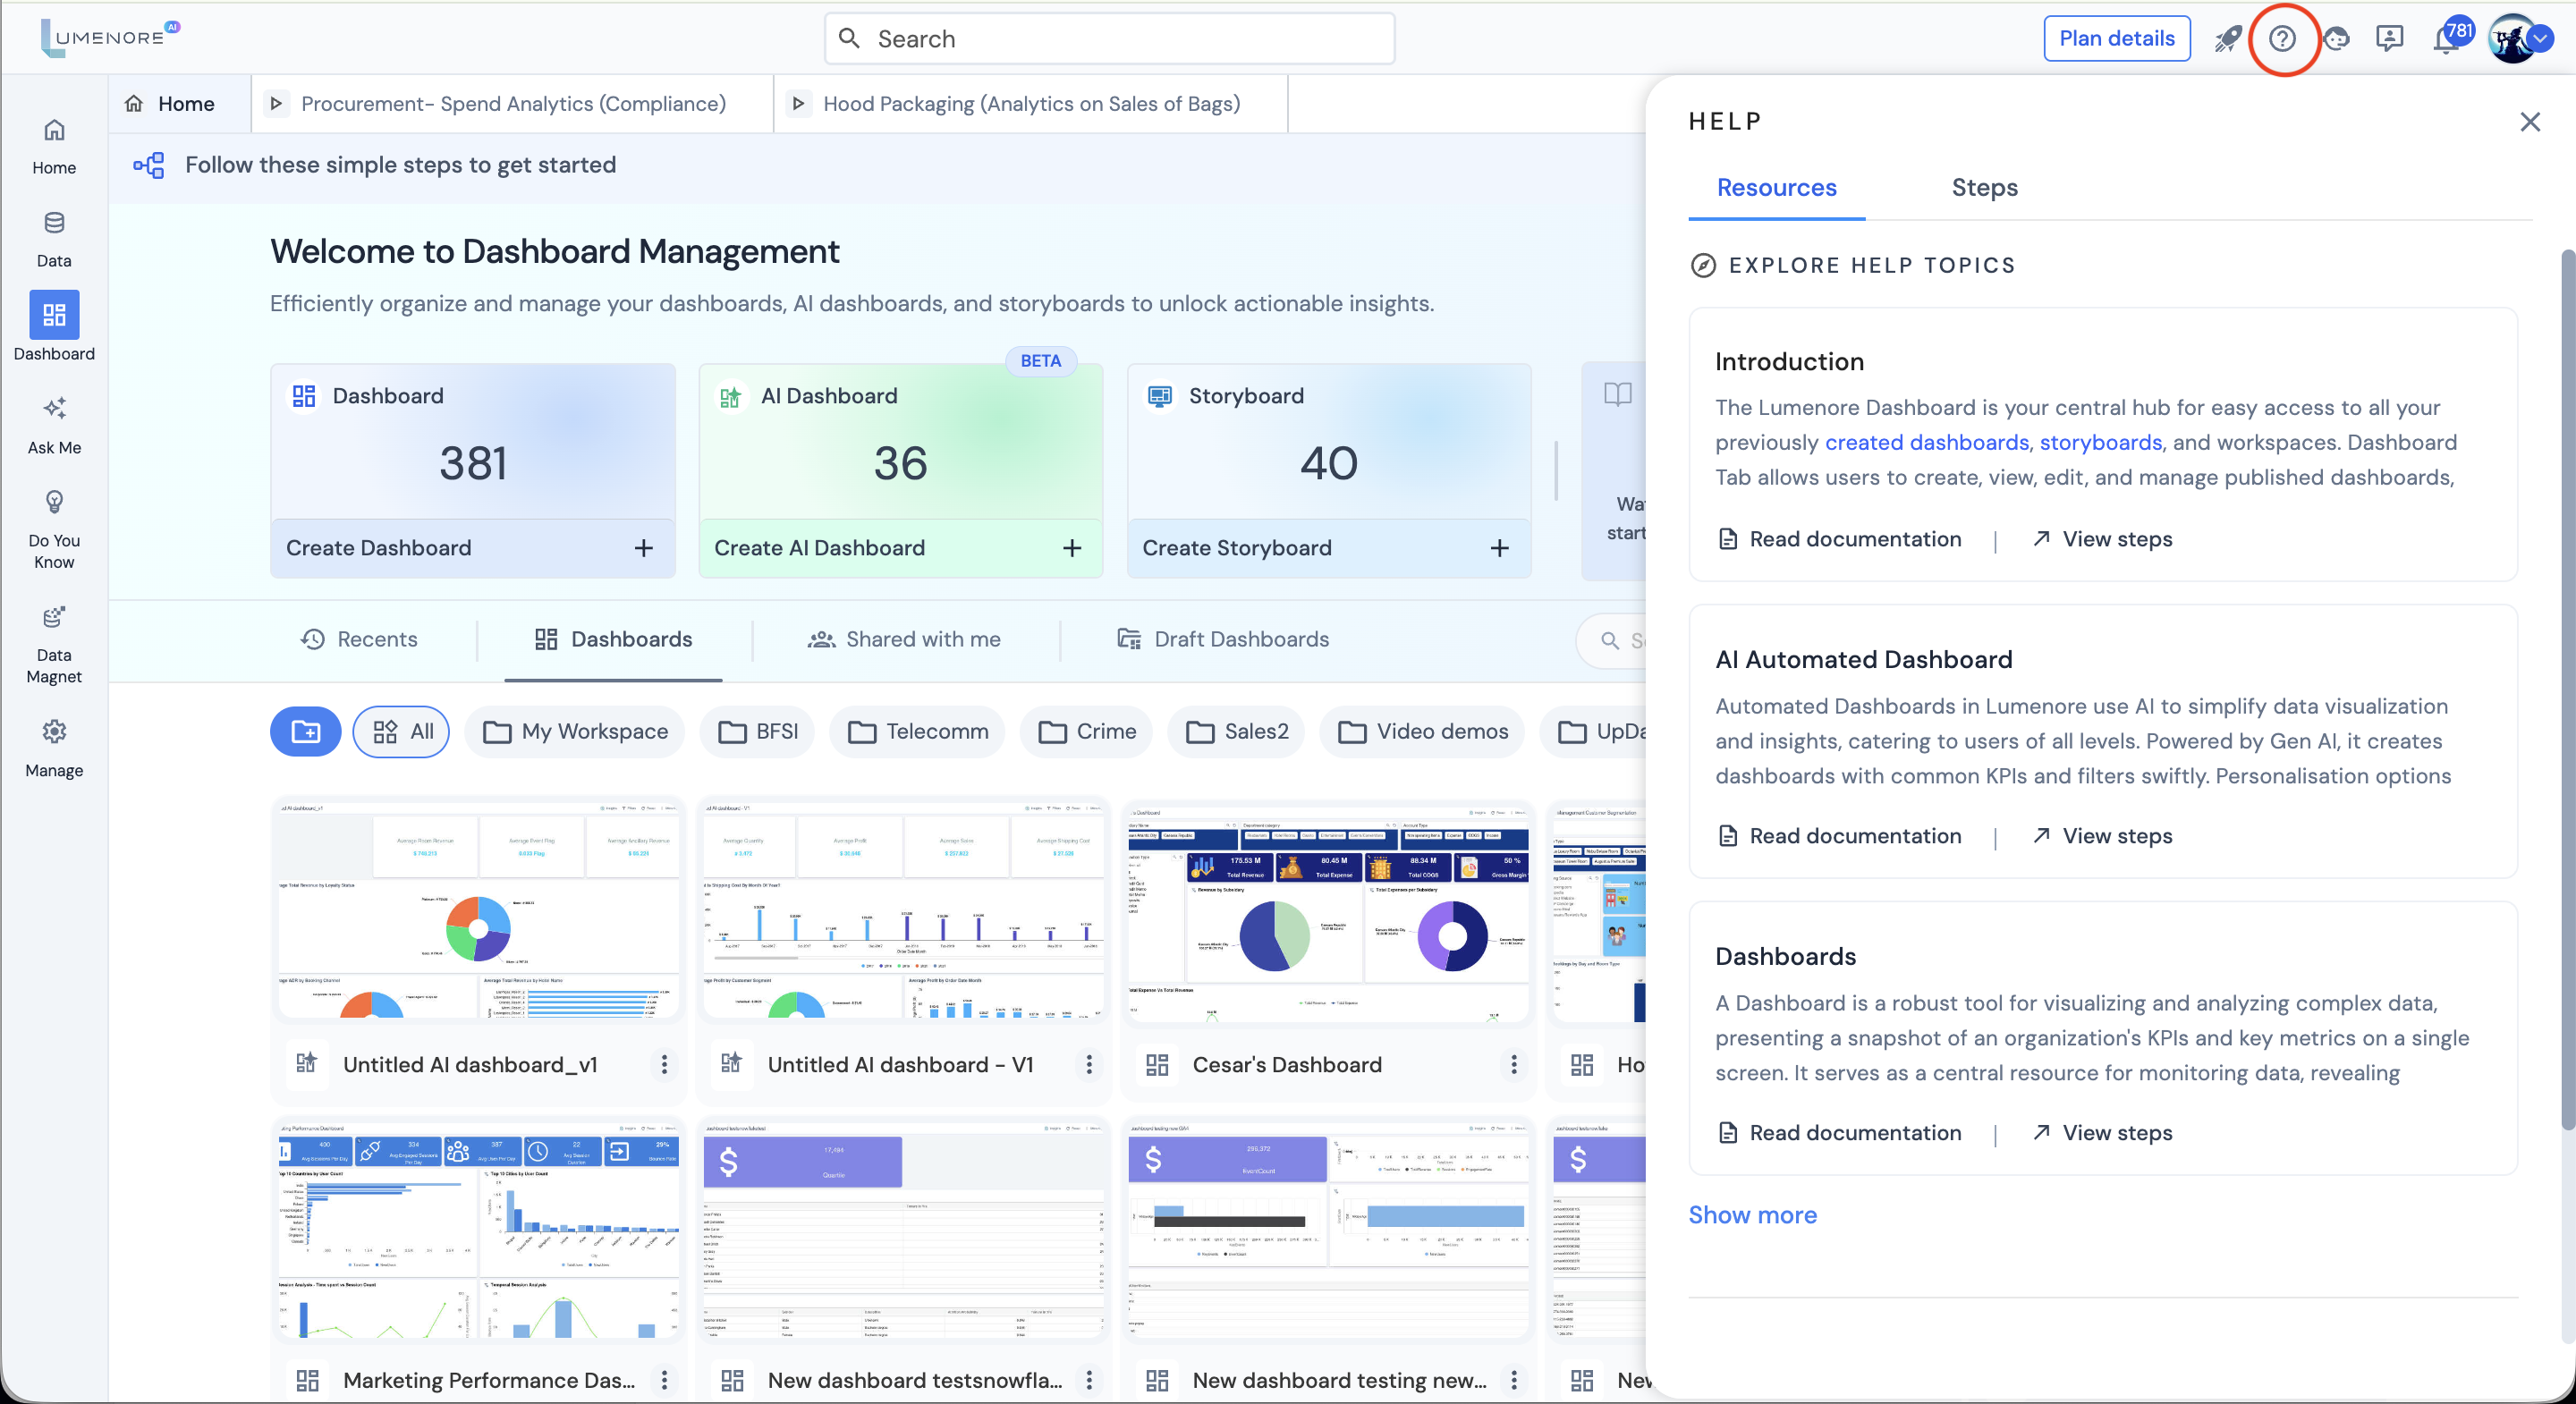
Yes, Once you are in the Lumenore Dashboard module, you can access the Help section from the top-right corner. This will provide a comprehensive user guide covering the dashboard module, along with its key features and functionalities.
Yes, Once you are in the Lumenore Dashboard module, you can access the Help section from the top-right corner. This will provide a comprehensive user guide covering the dashboard module, along with its key features and functionalities.
See lessWhat are some features available within the Schema Manager.
Use below url to explore the schema manger & all the available features. https://help.lumenore.com/knowledge-base/schema-manager/
Use below url to explore the schema manger & all the available features.
See lesshttps://help.lumenore.com/knowledge-base/schema-manager/
how to set filters in dashboard
You can set the filters in dashboard to view only required information when needed. Use below urls to explore how to create filters and how to use it in dashboard. Creating Filter: https://help.lumenore.com/knowledge-base/dashboard/creating-filters/ Apply Filter: https://help.lumenore.com/knowledge-Read more
You can set the filters in dashboard to view only required information when needed.
Use below urls to explore how to create filters and how to use it in dashboard.
Creating Filter: https://help.lumenore.com/knowledge-base/dashboard/creating-filters/
See lessApply Filter: https://help.lumenore.com/knowledge-base/dashboard/interacting-with-dashboard/dashboard-filter-set-preference/
How do I embed Lumenore dashboards into our internal application
In Lumenore, you can embed any dashboard, chart & insight quickly into your applications or systems. All you need is to open the desired dashboard, select the embed option, generate the embed url and use it to integrate the visualisation in your application workflow. For detailed use guide on emRead more
In Lumenore, you can embed any dashboard, chart & insight quickly into your applications or systems. All you need is to open the desired dashboard, select the embed option, generate the embed url and use it to integrate the visualisation in your application workflow.
For detailed use guide on embedding, visit our knowledge base page using below mentioned url.
See lesshttps://help.lumenore.com/knowledge-base/dashboard/interacting-with-dashboard/dashboard-embed/
How to create Geo Map KPI in Lumenore
I also have same doubt.
I also have same doubt.
See less