Sign In

Welcome Back,

Signup/Login with your account

You must login to ask a question.

You must login to add post.

Please briefly explain why you feel this question should be reported.

Please briefly explain why you feel this answer should be reported.

Please briefly explain why you feel this user should be reported.

  • 0
mkishore@lumenore.com
Beginner

Top Performer by Month

I am looking to generate a report showcasing the top performer by month. There are 50+ agents in the team and I need to show the top review count for each month with name of agent and the count processed by the agent.

Leave an answer

You must login to add an answer.

1 Answer

  1. Hi,
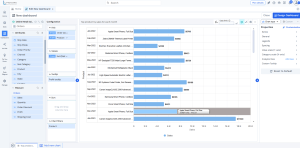
    Please follow the below steps to create a chart in Dashboard module (Attached sample retail screenshot) :

    1. Drag and drop Agent column in Axis
    2. Drag and drop Month column in Axis
    3. Make Month as ‘group’ and product as ‘X axis’ by clicking on the column labels in Axis
    4. Drag and drop review count in values
    5. Drag and drop Agent column in Chart filters

      • Select Condition as : Top/ Botton N
      • Show type: Top
      • Select type: Custom
      • No of items: 1
      • By value: review count
    1. Your chart will be created. Make sure chart type: Grouped chart in Horizontal Bars section
    2. If you also want to see ‘count processed’ by each agent, drag and drop this column in tooltip
    3. Enable ‘data labels’ in ‘Customization’ under ‘General’ tab to see values on chart.

    Please let us know if this solves your requirement, if not feel free to add comments for further discussions.