
 Signup/Login with Google
I was exploring custom layouts for adding widgets and charts, and I came across micro charts. What is the difference between regular charts and micro charts?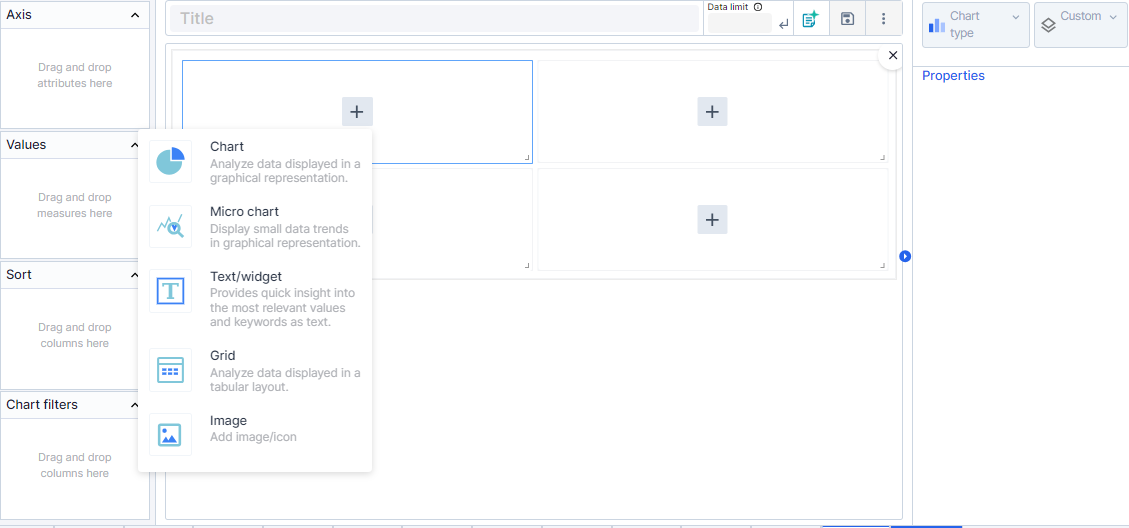
Sign In
Welcome Back,
Signup/Login with your account
Signup/Login with your account
Please briefly explain why you feel this question should be reported.
Please briefly explain why you feel this answer should be reported.
Please briefly explain why you feel this user should be reported.
Charts are comprehensive data visualization tools designed to display complex data sets with multiple measures and attributes, offering detailed insights and extensive customization options suitable for in-depth reports, presentations, and dashboards. They typically include various components like titles, axes labels, legends, and interactive features to facilitate detailed analysis and exploration of data.
Micro Charts are compact visualizations intended to depict small data trends succinctly, focusing on a single measure and attribute. They are designed for quick visual overviews within limited space, such as in dashboards and brief reports, offering three main types (Column, Line, Area) with minimalistic design and basic customization to provide immediate insights without the need for detailed interaction or extensive components.