Sign In
Welcome Back,
Signup/Login with your account
Signup/Login with your account
Please briefly explain why you feel this question should be reported.
Please briefly explain why you feel this answer should be reported.
Please briefly explain why you feel this user should be reported.

 Signup/Login with Google
can i add description for kpis?
Yes, you can add description for KPI's. When you are creating any particular chart, metric or KPI you can add its description, which can be accessed through the "i" button in published dashboard. Please read below guide to understand how it works: https://help.lumenore.com/knowledge-base/dashboard/iRead more
Yes, you can add description for KPI’s. When you are creating any particular chart, metric or KPI you can add its description, which can be accessed through the “i” button in published dashboard.
Please read below guide to understand how it works:
https://help.lumenore.com/knowledge-base/dashboard/interacting-with-chart/ai-insights/#information-icon
See lessWhat is Lumenore Ask Me and how does it help users?
Hi Saransh, Welcome to Lumenore Ask Me. I would recommend that you to go through these documents, which will help you to run questions in Ask Me. https://help.lumenore.com/knowledge-base/lumenore_ask_me/using-lumenore_ask_me/ https://help.lumenore.com/knowledge-base/lumenore_ask_me/working_guidelineRead more
Hi Saransh, Welcome to Lumenore Ask Me.
I would recommend that you to go through these documents, which will help you to run questions in Ask Me.
Hope this helps.
See lessCan Ask Me understand natural language questions?
Yes, you can ask questions in Ask Me in simple English and get responses easily.
Yes, you can ask questions in Ask Me in simple English and get responses easily.
See lessDoes Ask Me support follow-up questions?
Yes Saransh, Ask Me supports follow-up questions and retains context from the previous few responses.
Yes Saransh, Ask Me supports follow-up questions and retains context from the previous few responses.
See lessHow to create dashboard using multiple schema
Yes, a dashboard can be created using multiple schemas in Lumenore by leveraging the “Change Schema” option at the chart level. How to Create a Dashboard Using Multiple Schemas Create a dashboard by selecting any initial schema and table. Add a new chart in the designer. At the chart level,Read more
Yes, a dashboard can be created using multiple schemas in Lumenore by leveraging the “Change Schema” option at the chart level.
How to Create a Dashboard Using Multiple Schemas
Let us know if you need any further assistance.
See lessHow can I add notes to my charts in a dashboard?
Yes, notes can be added at different levels in Lumenore, including chart level. Adding Notes to Charts Notes for charts are typically added using the KPI/Chart Description Editor. How it works: Open the chart or KPI in edit/design mode Use the Description/Editor option to add text Use formatting optRead more
Yes, notes can be added at different levels in Lumenore, including chart level.
Adding Notes to Charts
Notes for charts are typically added using the KPI/Chart Description Editor.
How it works:
Use cases:
Let us know if you need any further assistance.
See lessCan i add note to dashboard and on particular kpi ?
Yes, notes or descriptions can be added at both the dashboard level and the KPI level in Lumenore. Dashboard Level Notes Notes can be added to provide overall context or summary for the entire dashboard. Steps: Open the dashboard. Click on “More Options” (⋮) in the top-right corner. Select “Notes.”Read more
Yes, notes or descriptions can be added at both the dashboard level and the KPI level in Lumenore.
Dashboard Level Notes
Notes can be added to provide overall context or summary for the entire dashboard.
Steps:
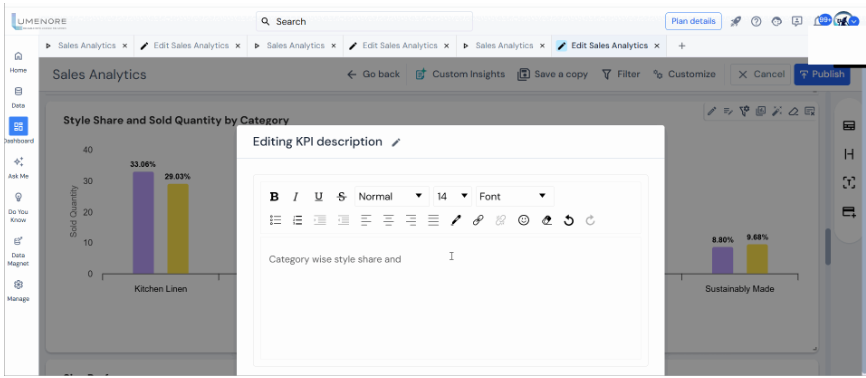
KPI Level Notes/Description
For individual KPIs, descriptions can be added using the KPI Description Editor.
How it works:
See lessDifference between ai dashboard and ai insights board ?
The AI Dashboard and AI Insights Board in Lumenore are both AI-powered features, but they differ in their purpose, output, and usage. An AI Dashboard focuses on data visualization and exploration. It automatically generates KPIs, charts, filters, and layouts using AI based on the dataset. It is desRead more
The AI Dashboard and AI Insights Board in Lumenore are both AI-powered features, but they differ in their purpose, output, and usage.
An AI Dashboard focuses on data visualization and exploration. It automatically generates KPIs, charts, filters, and layouts using AI based on the dataset. It is designed to help analyze data visually and interactively, with features like advanced analytics (trend, correlation, outliers, top/bottom KPIs) and customization options such as changing charts, adding KPIs, and applying filters.
An AI Insights Board, on the other hand, focuses on narrative insights and decision-making. It generates text-based insights, observations, alerts, and recommendations in a unified view. Instead of multiple visuals, it presents data in a clear, easy-to-read format, highlighting key trends, anomalies, and important changes like spikes or drops. Supporting KPIs and charts can be added, but the primary focus is on insights.
In simple terms, AI Dashboard helps explore what is happening through visuals, while AI Insights Board explains what is happening and why through AI-generated insights. For best results, both can be used together-AI Dashboards for deep analysis and AI Insights Boards for summarizing and presenting key findings effectively.
Steps to Access AI Dashboard / AI Insights Board
Let us know if you need any further assistance.
See lessWhat is the best way to configure data cards to show a comparison between the current period and the previous period?
To configure data cards to compare Current and Previous month metric please follow the below steps: 1. Open the dashboard in which you wish to add this. 2. Click on edit to go to chart designer page. 3. Click on create calculated measure as shown below: 4. Write the formula as shown for calculatingRead more
To configure data cards to compare Current and Previous month metric please follow the below steps:
1. Open the dashboard in which you wish to add this.
2. Click on edit to go to chart designer page.
3. Click on create calculated measure as shown below:
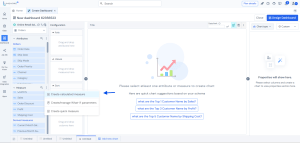


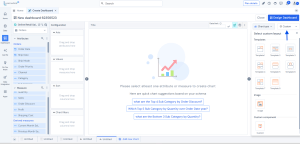


4. Write the formula as shown for calculating previous month sales and current month sales. You can choose your own date and measure column based on your data:
5. Validate and save the measure.
6. You can then create 2 separate widgets or 1 custom widget to compare these side by side:
7. Apply formatting as per your need:
8. Go to the dashboard designer, arrange the card and publish.
See lessWhat is guided RCA?
Guided RCA (Root Cause Analysis) in Lumenore is an AI-powered feature that automatically identifies and explains the key drivers behind changes in a metric, without requiring manual deep analysis. It helps quickly understand why a KPI has increased or decreased by analyzing data across different diRead more
Guided RCA (Root Cause Analysis) in Lumenore is an AI-powered feature that automatically identifies and explains the key drivers behind changes in a metric, without requiring manual deep analysis.
It helps quickly understand why a KPI has increased or decreased by analyzing data across different dimensions.
How it Works:
- Changing the attribute dynamically updates the analysis
See less